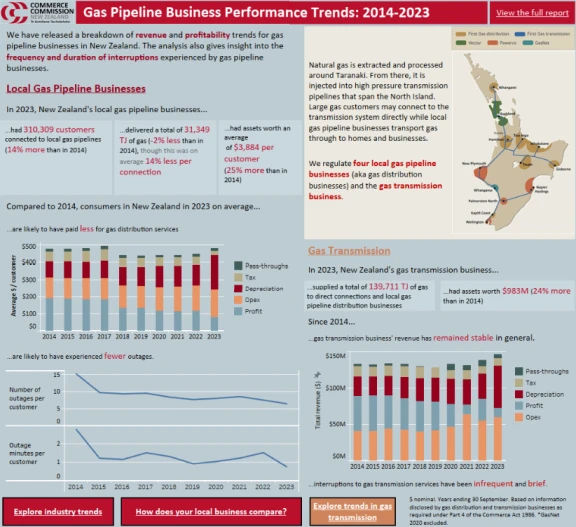
Trends in gas pipeline business performance
We have released a breakdown of revenue, profitability and reliability trends for gas pipeline businesses.
Under Part 4 of the Commerce Act 1986 (the Act), we are responsible for regulating the gas pipeline services provided by four gas distribution businesses, or local gas pipeline businesses (FirstGas, GasNet, Vector and Powerco), and the gas transmission business, First Gas.
The purpose of this analysis is to help people understand the drivers for change in the price and quality of services provided by the regulated gas distribution and gas transmission businesses (collectively, gas pipeline businesses) since 2014.
Alongside a comprehensive report, we have also published a fact sheet to provide a brief overview of the key results and an approach paper that describes our analytical approach and the legislative context in which we undertook this analysis. You can explore the full analysis using our interactive Tableau dashboard.
The analysis has been produced using the data that these gas pipeline businesses are required to publish in accordance with our information disclosure (ID) requirements for the industry.
Please note: there are viewing issues in some versions of Internet Explorer. We recommend using an alternative web browser such as Google Chrome or Microsoft Edge for the best experience.
What portion of my gas bill does the Commerce Commission regulate?
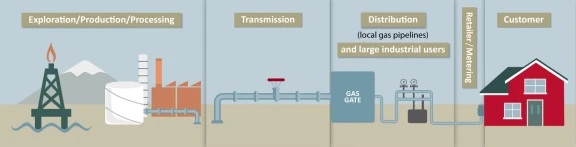
The gas transmission business transports gas from processing facilities to directly connected customers and to gas distribution networks (also known as local gas pipelines).
Local gas pipeline businesses transport gas from the transmission network to households and businesses.
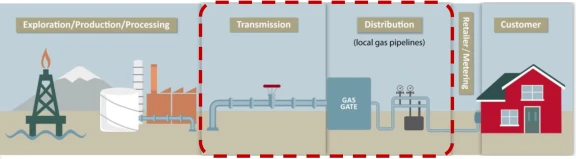
Under Part 4 of the Commerce Act 1986, we have a role regulating markets where there is little or no competition (and little prospect of future competition). We regulate four local gas pipeline businesses (FirstGas, GasNet, Vector and Powerco) and the gas transmission business (FirstGas from 2016, Vector and Maui Development prior).
Gas pipeline businesses’ revenue comes almost entirely from pipeline charges, ultimately paid by gas customers. Historically, the combined gas transmission and distribution charges have made up approximately 40-45% of the average customer’s gas bill.
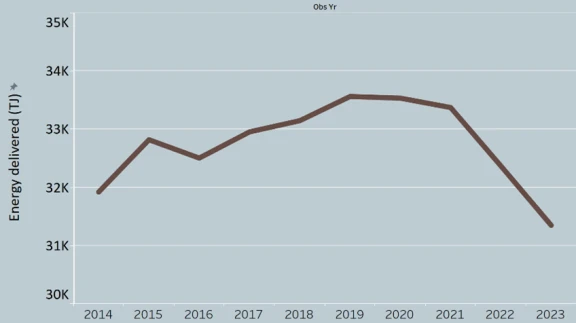
The volume of energy delivered by local gas pipeline businesses decreased noticeably from 2021 onwards
After a gradual increase prior to 2021, the volume of energy delivered through local gas pipeline businesses fell since 2021. The reduction amounts to 6%. This decrease is attributable to industrial and commercial customers reducing their demand because they have shut down or switched their energy supply to electricity.
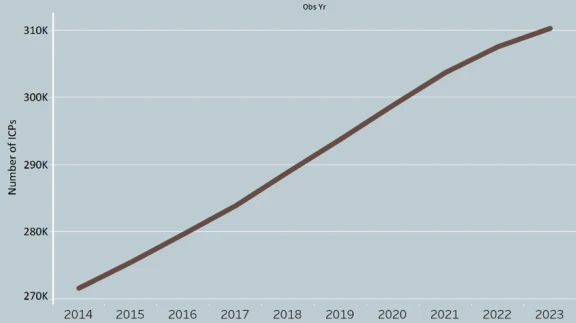
The number of customers connected to gas pipeline businesses has continued to grow, although the rate of growth has slowed since 2021. This growth is due to ongoing connections by residential customers, especially in new subdivision developments.
You can learn more about the industry and each gas pipeline business on our dashboard and in our report.
Volume of energy delivered by local gas pipeline businesses, 2014-2023
Number of customers connected to local gas pipeline businesses, 2014-2023
Revenue breakdown and profitability
Gas pipeline businesses’ revenue recovers operating expenditure, depreciation, cash profit, tax and other costs.
Revenue per customer of local gas pipeline businesses, 2014-2023
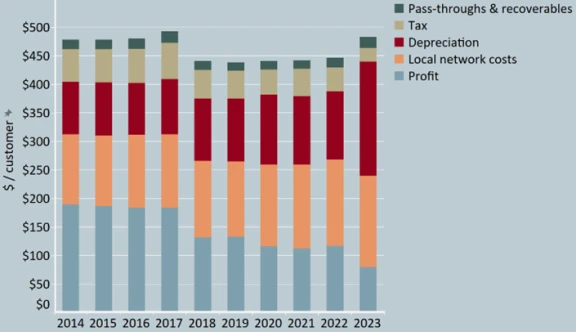
Revenue per customer for local gas pipeline businesses was relatively stable between 2014 and 2023. On average, customers paid $4 more per year in 2023 than they did in 2014. Cash profit decreased but depreciation increased in 2023 because of the shortened asset lives allowed in the third Gas default price-quality path reset (Gas DPP3).
Revenue components of gas transmission businesses, 2014-2023
Gas transmission businesses’ revenue increased by $13.6 million (10.2%) between 2014 and 2023. In 2023, cash profit decreased noticeably but depreciation increased due to the shortened asset lives allowed in the Gas DPP3.
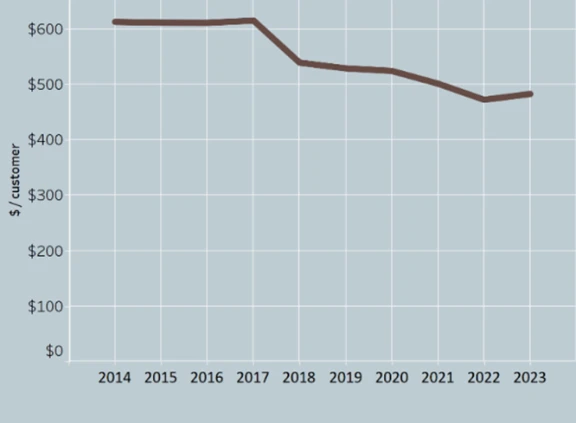
Real revenue per customer of local gas pipeline businesses, 2014-2023
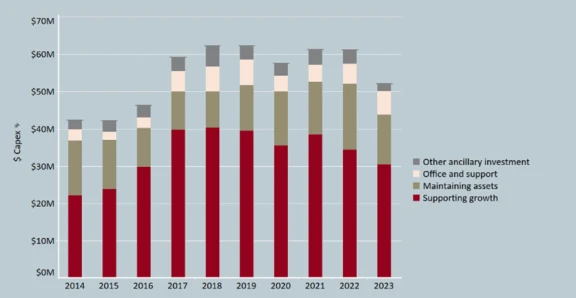
Local gas pipeline businesses’ capex was $6 million (13%) higher in 2023 than in 2016. Gas transmission businesses’ capex was $8 million (15.7%) lower in 2023 than in 2016.
The RAB of all local gas pipeline businesses was valued at $1.2 billion in 2023, a 45.7% increase since 2014. Gas transmission businesses’ RAB was valued at $983 million in 2023, an increase of 24% since 2014.
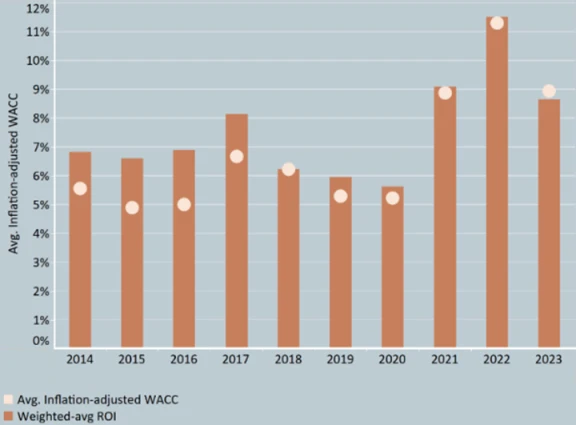
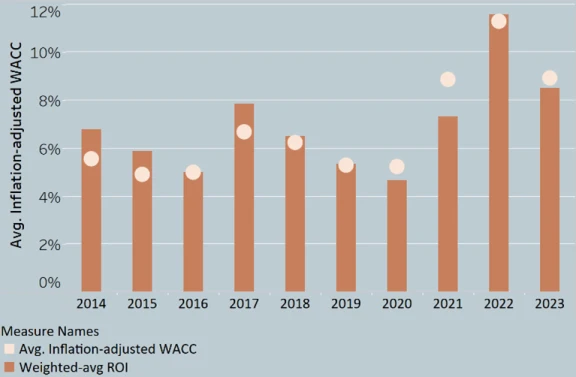
Local gas pipeline businesses have not made excessive profits between 2014 and 2023.
The return on investment (ROI) for each local gas pipeline and gas transmission business is consistent with the weighted-average cost of capital (WACC) that we estimate when we set their default price-quality paths (DPPs).
Local gas pipeline businesses’ return on investment compared to the inflation adjusted WACC, 2014 - 2023
Gas transmission businesses’ return on investment compared to the inflation adjusted WACC, 2014 – 2023
Regulated asset base and service reliability
Local gas pipeline businesses’ capex was $6 million (13%) higher in 2023 than in 2016. Gas transmission businesses’ capex was $8 million (15.7%) lower in 2023 than in 2016.
The RAB of all local gas pipeline businesses was valued at $1.2 billion in 2023, a 45.7% increase since 2014. Gas transmission businesses’ RAB was valued at $983 million in 2023, an increase of 24% since 2014.
Capital expenditure of local gas pipeline businesses, 2016-2023
The reliability of local gas pipeline businesses has generally improved between 2014 and 2023.
Number of interruptions customers of local gas pipeline businesses, 2014-2023
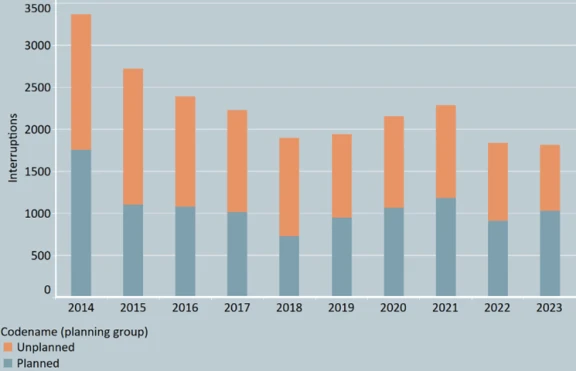
Between 2014 and 2023, the reliability of local gas pipeline businesses has generally improved, with fewer interruptions over time. The number of interruptions has decreased by 46% during this period.
Number of emergencies on local gas pipeline businesses, 2014-2023
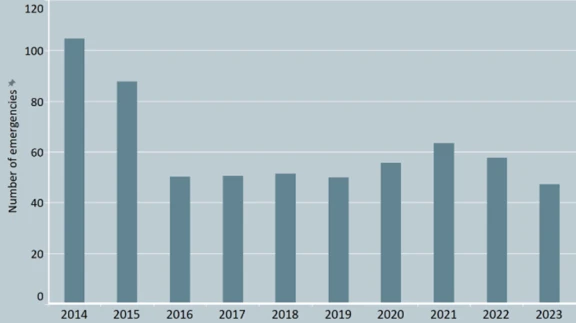
The number of emergencies has generally decreased between 2014 and 2023, by 54.9% during this period.
Number of incidents on gas transmission businesses, 2018-2023
The number of incidents of gas transmission businesses have fluctuated between 2018 and 2023.
Number of interruptions on gas transmission businesses, 2018-2023
The number of unplanned interruptions has generally trended down between 2018 and 2023. The number of planned interruptions has remained low and relatively stable during this period.
Why did the Commerce Commission conduct this analysis?
Part of our role is to require gas pipeline businesses to disclose information about their performance and for us to share our analysis of that performance. This analysis helps stakeholders to better understand how individual businesses are performing and whether the purposes of Part 4 of the Commerce Act are being met.
Feedback
We welcome feedback to help improve the depth and quality of our insights in future analysis. Please send your feedback or ideas for future trend analysis to infrastructure.regulation@comcom.govt.nz.